
Chapter 14 Using the Systems Management Web Console
Using the Web console
The Web console provides two access points for remote administration:
- Systems Management - allows
you to perform basic management functions, such as reading error
logs, or starting and stopping services.
- Systems Management Access Control - allows
you to limit which users can access or modify the state of managed
systems using the Web console.
You must log in to each of these access points individually.
 Connecting to the Web
console
- In your Web browser, go to:
http://host:port/SysMgmt/mgmt
Where host and port match
the HTTP listener address of the server that hosts the systems management
application. The default host is the machine name, and the default
port is 8080.
- Click the plus-sign icon next to either Systems Management
or Systems Management Access Control. A login window displays.
- Enter:
- Host name - the name or IP
address of the machine where systems management is installed.
- Port - the IIOP port number of the EAServer
that is hosting the systems management installation. This is the
port number that you assigned to EAServer during installation and
configuration. The default is 9000.
- Login - the user name used to log in to
EAServer, or if you have installed the optional Enterprise Portal
features, a user name valid for the portal security accounts database.
- Password - the password that matches the
user name.
- Once you have successfully logged in, click the plus-sign
icon next to the folder you have just logged into to see the contents.
The user interface controls
The Web console provides tree viewer controls for management
and access control. You must log in to either before you can expand
and navigate the tree view.
Navigating the tree view
When you first log in, the tree view is collapsed. Use the
plus-sign to expand the tree view and your Web browser displays
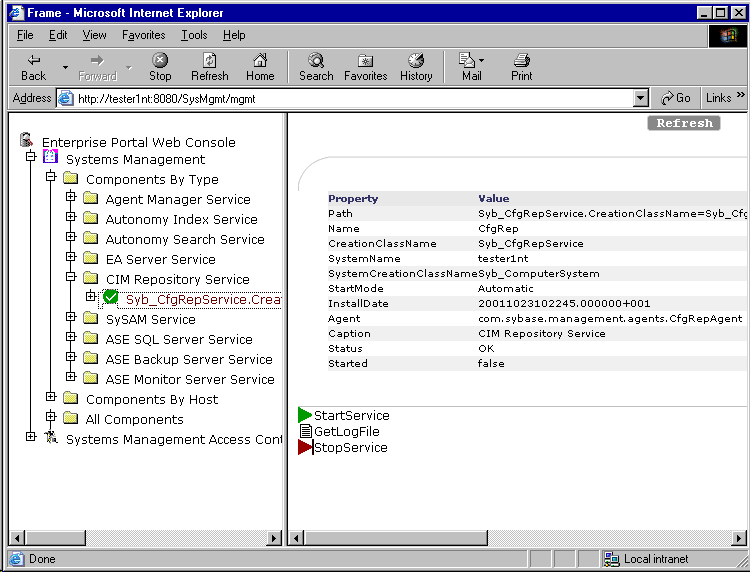
two panes similar to those shown in Figure 14-1. The tree view in the left pane expands
and collapses to show the hierarchical view of managed services.
When you highlight a specific item in the tree, detailed information
about the item displays in the details view in the right pane. In
the tree view, you can expand items by clicking on the plus-sign
icons next to each folder, and collapse the hierarchy by clicking
on the minus-sign icons. Items that lack a plus-sign icon cannot
be expanded.
Figure 14-1: Web console view

The details pane
The details pane shows details for the item you have highlighted
in the tree view pane on the right. The details that display vary
from component to component, and depend upon the component's
configuration description defined in the CIM Repository.
When you select an installed component that is listed in the
tree view, the details panel displays two columns:
- Property - this column displays
property names of the component, such as system name where the component
is installed, name of the component, and the name of the service.
- Value - this column displays the values
of the properties from the first column. Values include things such
as status, directory paths to installed classes, and the actual
name of the service.
|
Copyright © 2002 Sybase, Inc. All rights reserved.
|

|


![]() Connecting to the Web
console
Connecting to the Web
console